


Preliminary area planted estimate for summer crops (2026) and the sixth production estimate for winter cereals (2025)
Voorlopige oppervlakteskatting vir somergewasse (2026) en die sesde produksieskatting vir wintergewasse (2025)
Summer crops / Somergewasse
- Summer crops / Somergewasse
- Graph: Total maize / Grafiek: Totale mielies
- Graph: Sunflower seed / Grafiek: Sonneblomsaad
- Graph: Soybeans / Grafiek: Sojabone
- White and yellow maize / Wit- en geelmielies
- Sunflower seed / Sonneblomsaad
- Soybeans / Sojabone
- Groundnuts / Grondbone
- Dry beans / Droëbone
- Sorghum
- Notes / Aantekeninge
Winter cereals / Wintergewasse
- Winter Cereals / Wintergewasse
- Wheat / Koring
- Graph: Wheat / Grafiek: Koring
- Graph: Barley / Grafiek: Gars
- Graph/Grafiek: Canola
- Notes / Aantekeninge

Estimates courtecy of the Crop Estimates Committee
Syfers deur die Oesskattingskomitee verskaf
| Crop / Gewas | Preliminary area planted Voorlopige oppervlakte beplant |
Intentions ¹ Voorneme ¹ |
Area planted Oppervlakte beplant |
Final estimate ² Finale skatting ² |
Change Verandering |
|---|---|---|---|---|---|
| 2026 | 2026 | 2025 | 2025 | 2026 vs 2025 | |
| Ha | Ha | Ha | Tons | % | |
| (A) | (B) | (C) | (D) | (A) ÷ (C) | |
| Commercial / Kommersieël | |||||
| White maize / Witmielies | 1 644 200 | 1 614 700 | 1 599 700 | 8 378 250 | 2.78 |
| Yellow maize / Geelmielies | 1 030 000 | 1 051 000 | 997 000 | 8 057 400 | 3.31 |
| Total Maize / Totale Mielies | 2 674 200 | 2 665 700 | 2 596 700 | 16 435 650 | 2.98 |
| Sunflower seed / Sonneblomsaad | 560 800 | 531 100 | 555 700 | 708 300 | 0.92 |
| Soybeans / Sojabone | 1 185 000 | 1 179 200 | 1 151 000 | 2 771 225 | 2.95 |
| Groundnuts / Grondbone | 43 650 | 42 240 | 48 125 | 62 474 | -9.30 |
| Sorghum | 39 000 | 39 250 | 41 150 | 146 605 | -5.22 |
| Dry beans / Droëbone | 36 400 | 36 420 | 45 620 | 90 556 | -20.21 |
| Total / Totaal | 4 539 050 | 4 493 910 | 4 438 295 | 20 214 810 | 2.27 |
¹ Soos middel Oktober 2025/ As mid October 2025
² 27 November 2025
Nota: Estimate is for calendar year, for example production season 2025/2026 = 2026
Nota: Skatting is vir kalenderjaar, byvoorbeeld produksie-seisoen 2025/2026 = 2026
Area planted 2016-2026 Oppervlakte beplant

Area planted 2016-2026 Oppervlakte beplant
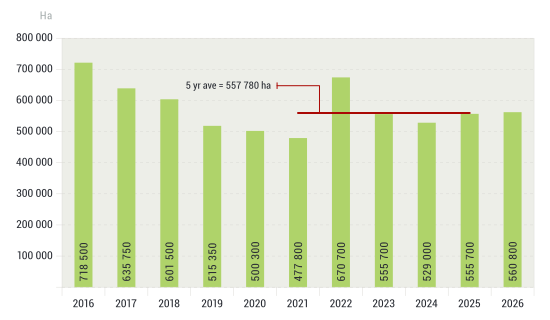
Area planted 2016-2026 Oppervlakte beplant
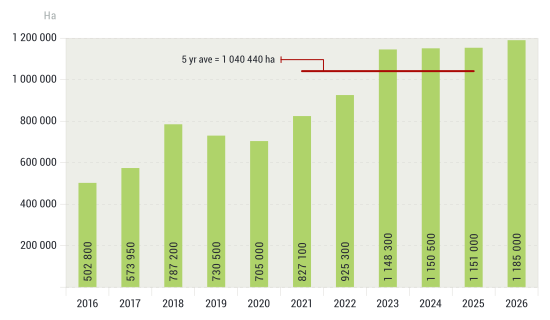
| Preliminary area planted Voorlopige oppervlakte beplant |
Area planted Oppervlakte beplant |
Final estimate ¹ Finale skatting ¹ |
||||||
|---|---|---|---|---|---|---|---|---|
| 2026 | 2025 | 2025 | ||||||
| White Wit |
Yellow Geel |
Total Totaal |
White Wit |
Yellow Geel |
Total Totaal |
White Wit |
Yellow Geel |
Total Totaal |
| Ha | Ha | Tons | ||||||
| Western Cape / Wes-Kaap | ||||||||
| 200 | 4 000 | 4 200 | 200 | 3 500 | 3 700 | 1 900 | 32 900 | 34 800 |
| Northern Cape / Noord-Kaap | ||||||||
| 3 000 | 42 000 | 45 000 | 1 500 | 42 000 | 43 500 | 18 750 | 676 200 | 694 950 |
| Free State / Vrystaat | ||||||||
| 860 000 | 350 000 | 1 210 000 | 850 000 | 345 000 | 1 195 000 | 4 292 500 | 2 484 000 | 6 776 500 |
| Eastern Cape / Oos-Kaap | ||||||||
| 6 000 | 30 000 | 36 000 | 6 000 | 28 000 | 34 000 | 42 600 | 232 400 | 275 000 |
| KwaZulu-Natal | ||||||||
| 47 000 | 70 000 | 117 000 | 50 000 | 66 000 | 116 000 | 315 000 | 600 600 | 915 600 |
| Mpumalanga | ||||||||
| 172 000 | 372 000 | 544 000 | 162 000 | 362 000 | 524 000 | 1 093 500 | 2 950 300 | 4 043 800 |
| Limpopo | ||||||||
| 16 000 | 20 000 | 36 000 | 10 000 | 18 500 | 28 500 | 71 000 | 159 100 | 230 100 |
| Gauteng | ||||||||
| 60 000 | 60 000 | 120 000 | 55 000 | 57 000 | 112 000 | 357 500 | 453 150 | 810 650 |
| North West / Noordwes | ||||||||
| 480 000 | 82 000 | 562 000 | 465 000 | 75 000 | 540 000 | 2 185 500 | 468 750 | 2 654 250 |
| Total / Totaal | ||||||||
| 1 644 200 | 1 030 000 | 2 674 200 | 1 599 700 | 997 000 | 2 596 700 | 8 378 250 | 8 057 400 | 16 435 650 |
¹ 27 November 2025
| Province / Provinsie | Preliminary area planted Voorlopige oppervlakte beplant |
Area planted Oppervlakte beplant |
Final estimate ¹ Finale skatting ¹ |
|---|---|---|---|
| Ha | Ha | Tons | |
| 2026 | 2025 | 2025 | |
| Western Cape / Wes-Kaap | 0 | 0 | 0 |
| Northern Cape / Noord-Kaap | 500 | 1 000 | 2 300 |
| Free State / Vrystaat | 280 000 | 264 500 | 383 525 |
| Eastern Cape / Oos-Kaap | 500 | 700 | 1 400 |
| KwaZulu-Natal | 800 | 1 000 | 2 000 |
| Mpumalanga | 3 000 | 2 500 | 3 625 |
| Limpopo | 95 000 | 90 000 | 90 000 |
| Gauteng | 1 000 | 1 000 | 1 200 |
| North West / Noordwes | 180 000 | 195 000 | 224 250 |
| Total / Totaal | 560 800 | 555 700 | 708 300 |
| Province / Provinsie | Preliminary area planted Voorlopige oppervlakte beplant |
Area planted Oppervlakte beplant |
Final estimate ¹ Finale skatting ¹ |
|---|---|---|---|
| Ha | Ha | Tons | |
| 2026 | 2025 | 2025 | |
| Western Cape / Wes-Kaap | 0 | 0 | 0 |
| Northern Cape / Noord-Kaap | 2 000 | 2 000 | 7 200 |
| Free State / Vrystaat | 604 000 | 565 000 | 1 271 250 |
| Eastern Cape / Oos-Kaap | 5 500 | 5 500 | 16 500 |
| KwaZulu-Natal | 44 000 | 47 000 | 190 350 |
| Mpumalanga | 312 000 | 315 000 | 771 750 |
| Limpopo | 16 000 | 16 500 | 51 975 |
| Gauteng | 51 500 | 51 000 | 114 400 |
| North West / Noordwes | 150 000 | 148 000 | 347 800 |
| Total / Totaal | 1 185 000 | 1 151 000 | 2 771 225 |
| Province / Provinsie | Preliminary area planted Voorlopige oppervlakte beplant |
Area planted Oppervlakte beplant |
Final estimate ¹ Finale skatting ¹ |
|---|---|---|---|
| Ha | Ha | Tons | |
| 2026 | 2025 | 2025 | |
| Western Cape / Wes-Kaap | 0 | 0 | 0 |
| Northern Cape / Noord-Kaap | 2 500 | 3 100 | 8 525 |
| Free State / Vrystaat | 16 000 | 21 700 | 29 295 |
| Eastern Cape / Oos-Kaap | 0 | 0 | 0 |
| KwaZulu-Natal | 200 | 175 | 184 |
| Mpumalanga | 0 | 0 | 0 |
| Limpopo | 2 650 | 1 650 | 2 970 |
| Gauteng | 0 | 0 | 0 |
| North West / Noordwes | 22 300 | 21 500 | 21 500 |
| Total / Totaal | 43 650 | 48 125 | 62 474 |
| Province / Provinsie | Preliminary area planted Voorlopige oppervlakte beplant |
Area planted Oppervlakte beplant |
Final estimate ¹ Finale skatting ¹ |
|---|---|---|---|
| Ha | Ha | Tons | |
| 2026 | 2025 | 2025 | |
| Western Cape / Wes-Kaap | 100 | 100 | 200 |
| Northern Cape / Noord-Kaap | 600 | 950 | 2 280 |
| Free State / Vrystaat | 10 000 | 17 500 | 28 875 |
| Eastern Cape / Oos-Kaap | 170 | 200 | 400 |
| KwaZulu-Natal | 1 200 | 3 000 | 5 100 |
| Mpumalanga | 1 200 | 2 320 | 4 176 |
| Limpopo | 16 000 | 11 100 | 30 525 |
| Gauteng | 930 | 950 | 1 900 |
| North West / Noordwes | 6 200 | 9 500 | 17 100 |
| Total / Totaal | 36 400 | 45 620 | 90 556 |
| Province / Provinsie | Preliminary area planted Voorlopige oppervlakte beplant |
Area planted Oppervlakte beplant |
Final estimate ¹ Finale skatting ¹ |
|---|---|---|---|
| Ha | Ha | Tons | |
| 2026 | 2025 | 2025 | |
| Western Cape / Wes-Kaap | 0 | 0 | 0 |
| Northern Cape / Noord-Kaap | 0 | 0 | 0 |
| Free State / Vrystaat | 8 000 | 12 800 | 46 080 |
| Eastern Cape / Oos-Kaap | 100 | 200 | 600 |
| KwaZulu-Natal | 100 | 100 | 380 |
| Mpumalanga | 7 500 | 9 200 | 44 160 |
| Limpopo | 18 000 | 13 000 | 36 400 |
| Gauteng | 550 | 850 | 3 485 |
| North West / Noordwes | 4 750 | 5 000 | 15 500 |
| Total / Totaal | 39 000 | 41 150 | 146 605 |
Summer crops / Somergewasse
Preliminary area estimate (2026) Voorlopige oppervlakteskatting
Summer field crops – 2026
The preliminary area estimate of today is primarily based on findings from a non-probability survey of farmers. The survey was conducted by the Directorate: Statistics and Economic Analysis of the Department of Agriculture. Please note that the area planted to crops refers to the area already planted for all purposes, including grain, silage and crop damaged area(s).
Commercial maize
The preliminary area estimate for maize is 2,674 million ha, which is 2,98% or 77 500 ha more than the 2,597 million ha planted for the previous season, and also 0,32% or 8 500 ha more than the intentions to plant figure of 2,666 million ha released in October 2025.
The preliminary area estimate for white maize is 1,644 million ha, which represents an increase of 2,78% or 44 500 ha compared to the 1,600 million ha planted last season. In the case of yellow maize, the area estimate is 1,030 million ha, which is 3,31% or 33 000 ha more than the 997 000 ha planted last season.
Other summer crops
Sunflower seed: The preliminary area estimate for sunflower seed is 560 800 ha, which is 0,92% or 5 100 ha more than the 555 700 ha planted the previous season.
Other crops
It is estimated that 1,185 million ha have been planted to soybeans, which represents an increase of 2,95% or 34 000 ha compared to the 1,151 million ha planted last season.
For groundnuts, the area estimate is 43 650 ha, which is 9,30% or 4 475 ha less than the 48 125 ha planted for the previous season.
The area estimate for sorghum decreased by 5,22% or 2 150 ha, from 41 150 ha to 39 000 ha against the previous season.
For dry beans, the area estimate is 36 400 ha, which is 20,21% or 9 220 ha less than the 45 620 ha planted for the previous season.
The revised area planted and production figures, which will be released by the Crop Estimates Committee on 26 February 2026, will mainly be based on information obtained from the Producer Independent Crop Estimation System (PICES) survey for the Free State, KwaZulu-Natal, Mpumalanga, Limpopo, Gauteng and North West provinces.
Information is available online at the Department of Agriculture, Land Reform and Rural Development or SAGIS, as from 14:30 on the date of the relevant meeting of the Crop Estimates Committee.
Somergewasse – 2025
Die voorlopige oppervlakteskatting van vandag is hoofsaaklik gebaseer op die resultate van 'n nie-waarskynlikheidsopname onder boere. Die opname is deur die Direktoraat: Statistiek en Ekonomiese Analise van die Departement van Landbou uitgevoer. Neem asseblief kennis dat die oppervlakte wat met gewasse beplant is, verwys na die area wat reeds vir alle doeleindes beplant is, insluitend graan, kuilvoer en gewas beskadigde area(s).
Kommersiële mielies
Die voorlopige skatting van die oppervlakte onder mielies beloop 2,674 miljoen ha, wat 2,98% of 77 500 ha meer is as die 2,597 miljoen ha wat verlede seisoen aangeplant is, en ook 0,32% of 8 500 ha meer as die voornemens om te plant syfer van 2,666 miljoen ha soos vrygestel in Oktober 2025.
Die voorlopige oppervlak onder witmielies is 1,644 miljoen ha, wat 'n toename van 2,78% of 44 500 ha verteenwoordig vergeleke met die 1,600 miljoen ha die vorige seisoen. In die geval van geelmielies is die oppervlakteskatting 1,030 miljoen ha, wat 3,31% of 33 000 ha meer is as die 997 000 ha geplant die vorige seisoen.
Ander somergewasse
Sonneblomsaad: Die voorlopige oppervlakteskatting vir sonneblomsaad is 560 800 ha, wat 0,92% of 5 100 ha meer is as die 555 700 ha aangeplant die vorige seisoen.
Ander gewasse
Die geskatte oppervlakte beplant met sojabone is 1,185 miljoen ha, wat 'n toename van 2,95% of 34 000 ha verteenwoordig vergeleke met die 1,151 miljoen ha geplant die vorige seisoen.
Vir grondbone is die oppervlakteskatting 43 650 ha, wat 9,30% of 4 475 ha minder is as die 48 125 ha geplant vir die vorige seisoen.
Die oppervlakteskatting vir sorghum het afgeneem met 5,22% of 2 150 ha, van 41 150 ha tot 39 000 ha teenoor die vorige seisoen.
Vir droëbone is die geskatte oppervlakte beplant 36 400 ha, wat 20,21% of 9 220 ha minder is as die 45 620 ha geplant vir die vorige seisoen.
Die hersiene aangeplante oppervlakte en produksiesyfers sal deur die Oesskattingskomitee op 26 Februarie 2026 vrygestel word en sal hoofsaaklik gebaseer wees op inligting verkry vanaf die Produsente Onafhanklike Oesskattingstelsel (“PICES”) opname vir die Vrystaat, KwaZulu-Natal, Mpumalanga, Limpopo, Gauteng en Noordwes provinsies.
Inligting is beskikbaar aanlyn by die Department of Agriculture, Land Reform and Rural Development of by SAGIS, vanaf 14:30 op die dag van die toepaslike vergadering van die Oesskattingskomitee.
| Crop / Gewas | Area planted Oppervlakte beplant |
Sixth forecast Sesde skatting |
Fifth forecast Vyfde skatting |
Area planted Oppervlakte beplant |
Final crop Finale oes |
Change / Verandering |
|---|---|---|---|---|---|---|
| 2025 | 2025 | 2025 | 2024 | 2024 | ||
| Ha | Tons | Tons | Ha | Tons | % | |
| (A) | (B) | (C) | (D) | (E) | (B) ÷ (C) | |
| Commercial / Kommersieël | ||||||
| Wheat / Koring | 517 300 | 1 932 120 | 1 986 680 | 505 300 | 1 930 000 | -2.7 |
| Barley / Gars | 96 950 | 350 730 | 350 730 | 100 700 | 372 250 | 0.0 |
| Canola | 174 515 | 311 850 | 311 850 | 165 750 | 290 400 | 0.0 |
| Oats / Hawer | 35 520 | 45 143 | 48 543 | 31 000 | 43 400 | -7.0 |
| Sweet lupins / Soetlupine | 21 000 | 18 900 | 21 000 | 16 000 | 19 200 | -10.0 |
| Total winter cereals / Totaal wintergewasse | 845 285 | 2 658 743 | 2 718 803 | 818 750 | 2 655 250 | -2.2 |
* Commercial only. Excluding barley or oats used as pasture, silage, hay and/or on the farm as fodder for livestock. / Slegs kommersieël. Uitgesluit gars of hawer wat gebruik word as weiding, kuilvoer, hooi en/of op die plaas as voer vir vee.
| Province / Provinsie | Area planted Oppervlakte beplant |
Sixth forecast Sesde skatting |
Area planted Oppervlakte beplant |
Final crop Finale oes |
|---|---|---|---|---|
| 2025 | 2025 | 2024 | 2024 | |
| Ha | Tons | Ha | Tons | |
| Western Cape / Wes-Kaap | 363 000 | 980 100 | 368 000 | 1 067 200 |
| Northern Cape / Noord-Kaap | 40 000 | 308 000 | 38 000 | 298 300 |
| Free State / Vrystaat | 57 000 | 279 300 | 49 000 | 225 260 |
| Eastern Cape / Oos-Kaap | 5 500 | 37 400 | 5 000 | 34 500 |
| KwaZulu-Natal | 8 500 | 52 700 | 8 300 | 52 290 |
| Mpumalanga | 3 500 | 22 750 | 3 500 | 24 500 |
| Limpopo | 28 000 | 173 600 | 20 500 | 145 550 |
| Gauteng | 800 | 5 120 | 1 000 | 6 800 |
| North West / Noordwes | 11 000 | 73 150 | 12 000 | 75 600 |
| Total / Totaal | 517 300 | 1 932 120 | 505 300 | 1 930 000 |
Production 2015-2025 Produksie

Production 2015-2025 Produksie
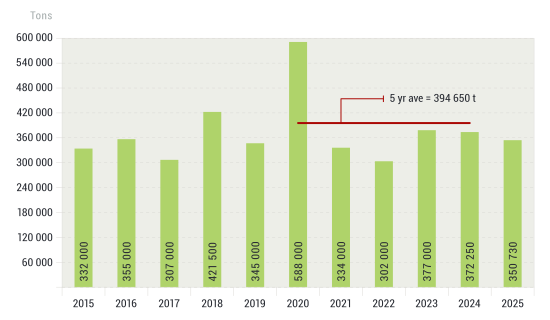
Production 2015-2025 Produksie
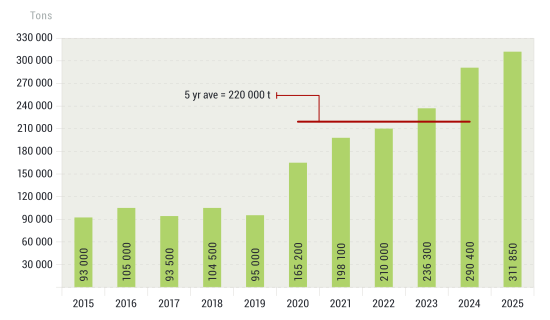
Winter cereal crops / Wintergewasse
Area estimate and sixth production forecast for 2025 / Oppervlakte- en sesde produksieskatting vir 2025
Winter cereal crops – 2025
Wheat
The expected production of wheat is 1,932 million tons, which is 2,75% or 54 560 tons less than the previous forecast of 1,987 million tons. The expected yield is 3,74 t/ha.
The expected production in the Western Cape is 980 100 tons (51%), which is 36 300 tons less than the previous month's forecast of 1,016 million tons. In the Northern Cape, 308 000 tons (16%) are expected to be produced – unchanged from the previous month's forecast. In the Free State, the expected production is 279 300 tons (14%), which is 11 400 tons less than the previous month's expected crop of 290 700 tons.
The area estimate for wheat is 517 300 ha, of which an estimated 363 000 ha or 70% is planted in the Western Cape, 57 000 ha or 11% in the Free State and 40 000 ha or 8% in the Northern Cape.
Other crops
The production forecast for barley remained unchanged at 350 730 tons. The area planted is estimated at 96 950 ha, while the expected yield is 3,62 t/ha.
The expected canola also remained unchanged at 311 850 tons. This is the largest canola crop on record. The area estimate for canola is 174 515 ha, with an expected yield of 1,79 t/ha.
The expected crop for oats for the 2025 season was further decreased by 7,00% or 3 400 tons, from 48 543 tons to 45 143 tons. The area planted is 35 520 ha. The expected yield is 1,27 t/ha.
In the case of sweet lupines, the production forecast is 18 900 tons, which is 10,00% or 2 100 tons less than the previous month's expected crop of 21 000 tons. The area estimate of sweet lupines is 21 000 ha, with an expected yield of 0,90 t/ha.
Please note that the final production estimate for winter cereals for 2025 will be released on 26 February 2026.
Information is available online at the Department of Agriculture, Land Reform and Rural Development or SAGIS, as from 14:30 on the date of the relevant meeting of the Crop Estimates Committee.
Wintergewasse – 2025
Koring
Die verwagte produksie vir koring is 1,932 miljoen ton, wat 2,75% of 54 560 ton minder is as die vorige skatting van 1,987 miljoen ton. Die verwagte opbrengs is 3,74 t/ha.
Die verwagte produksie in die Wes-Kaap is 980 100 ton (51%), wat 36 300 ton minder is as die vorige maand se skatting van 1,016 miljoen ton. In die Noord-Kaap word verwag dat 308 000 ton (16%) geproduseer sal word – wat onveranderd is van die vorige maand se skatting. In die Vrystaat is die verwagte produksie 279 300 ton (14%), wat 11 400 ton minder is as die vorige maand se verwagte oes van 290 700 ton.
Die oppervlakteskatting vir koring is 517 300 ha, waarvan 'n geraamde 363 000 ha of 70% in die Wes-Kaap geplant is, 57 000 ha of 11% in die Vrystaat en 40 000 ha of 8% in die Noord-Kaap.
Ander gewasse
Die produksieskatting vir gars is onveranderd gelaat op 350 730 ton. Die oppervlakte beplant word beraam op 96 950 ha, terwyl die verwagte opbrengs 3,62 t/ha beloop.
Die verwagte canola-oes is ook onveranderd gelaat op 311 850 ton. Dit is die grootste canola-oes op rekord. Die oppervlakteskatting vir canola is 174 515 ha, met 'n verwagte opbrengs van 1,79 t/ha.
Die verwagte oes vir hawer vir die 2025-seisoen is verder verminder met 7,00% of 3 400 ton, vanaf 48 543 ton na 45 143 ton. Die oppervlakteskatting is 35 520 ha. Die verwagte opbrengs is 1,27 t/ha.
In die geval van soetlupine is die produksieskatting 18 900 ton, wat 10,00% of 2 100 ton minder is as die vorige maand se verwagte oes van 21 000 ton. Die oppervlakte beplant met soetlupine is 21 000 ha, en die verwagte opbrengs is 0,90 t/ha.
Neem asseblief kennis dat die finale produksieskatting vir wintergewasse vir 2025 op 26 Februarie 2026 vrygestel sal word.
Inligting is beskikbaar aanlyn by die Department of Agriculture, Land Reform and Rural Development of by SAGIS, vanaf 14:30 op die dag van die toepaslike vergadering van die Oesskattingskomitee.
CONFIDENTIALITY ISSUES that CEC members are committed to adhere to on the day of the meeting
- Personal items such as laptops, handbags, cell phones, etc. are not allowed in the venue during the meeting.
- No member is allowed to leave the meeting before 12:00 in order to prevent disclosure of the information. The embargo time for the release of crop estimates information is 14:30.
- No member is allowed to discuss crop estimates information with anyone other than a member of the Committee before the embargo time. Only the Chairperson, or a member appointed by the Chairperson, may release the figures to the media.
- Members must regard the detail of any information that was collected for and/or discussed during the meeting, as confidential. Individual information received for crop estimate purposes is treated strictly confidential, and is not divulged for any other purposes.