


Eighth summer crops and second winter cereals production forecasts for 2025
Agtste somergewasse en tweede wintergewasse produksieskattings vir 2025
Summer crops / Somergewasse
- Summer crops / Somergewasse
- Graph: Total maize / Grafiek: Totale mielies
- Graph: Sunflower seed / Grafiek: Sonneblomsaad
- Graph: Soybeans / Grafiek: Sojabone
- White and yellow maize / Wit- en geelmielies
- Sunflower seed / Sonneblomsaad
- Soybeans / Sojabone
- Groundnuts / Grondbone
- Dry beans / Droëbone
- Sorghum
- Notes / Aantekeninge
- Non-commercial Maize / Nie-kommersiële mielies
Winter cereals / Wintergewasse
- Winter Cereals / Wintergewasse
- Wheat / Koring
- Graph: Wheat / Grafiek: Koring
- Graph: Barley / Grafiek: Gars
- Graph / Grafiek: Canola
- Notes / Aantekeninge

Estimates courtecy of the Crop Estimates Committee
Syfers deur die Oesskattingskomitee verskaf
| Crop / Gewas | Area planted Oppervlakte beplant |
Eighth forecast Agtste skatting |
Seventh forecast Sewende skatting |
Area planted Oppervlakte beplant |
Final crop Finale oes |
Change Verandering |
|---|---|---|---|---|---|---|
| 2025 | 2025 | 2025 | 2024 | 2024 | ||
| Ha | Tons | Tons | Ha | Tons | % | |
| (A) | (B) | (C) | (D) | (E) | (B) ÷ (C) | |
| Commercial / Kommersieël | ||||||
| White maize / Witmielies | 1 599 700 | 8 327 650 | 8 081 350 | 1 554 750 | 6 055 000 | 3.05 |
| Yellow maize / Geelmielies | 997 000 | 7 850 850 | 7 720 900 | 1 081 500 | 6 795 000 | 1.68 |
| Total Maize / Totale Mielies | 2 596 700 | 16 178 500 | 15 802 250 | 2 636 250 | 12 850 000 | 2.38 |
| Sunflower seed / Sonneblomsaad | 555 700 | 708 300 | 708 300 | 529 000 | 632 000 | 0.00 |
| Soybeans / Sojabone | 1 151 000 | 2 753 125 | 2 753 125 | 1 150 500 | 1 848 000 | 0.00 |
| Groundnuts / Grondbone | 48 125 | 61 389 | 61 389 | 41 200 | 52 000 | 0.00 |
| Sorghum | 41 150 | 144 665 | 137 970 | 42 100 | 98 000 | 4.85 |
| Dry beans / Droëbone | 45 620 | 90 556 | 86 407 | 39 550 | 50 495 | 4.80 |
| Total / Totaal | 4 438 295 | 19 936 535 | 19 549 440 | 4 438 600 | 15 530 495 | 1.98 |
| Non-commercial Maize / Nie-kommersiële Mielies | ||||||
| Total maize / Totaal mielies | 358 000 | 621 500 | 621 500 | 347 000 | 575 000 | 0.00 |
| Maize / Mielies: Commercial / Kommersieël + Non-commercial / Nie-kommersieël | ||||||
| Total maize RSA / Totaal mielies RSA | 2 954 700 | 16 800 000 | 16 423 750 | 2 983 250 | 13 425 000 | 2.29 |
Note: Estimate is for calendar year, for example production season 2024/2025 = 2025
Nota: Skatting is vir kalenderjaar, byvoorbeeld produksie-seisoen 2024/2025 = 2025
Production 2015-2025 Produksie
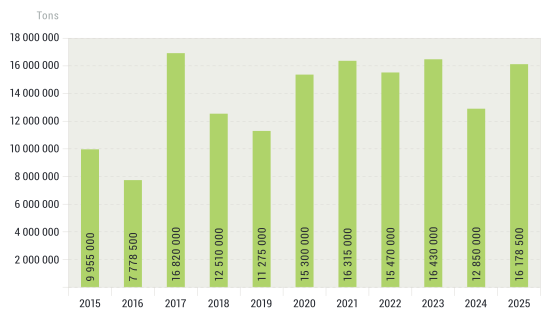
Production 2015-2025 Produksie
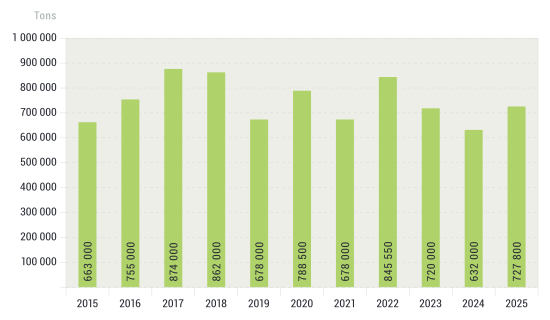
Production 2015-2025 Produksie
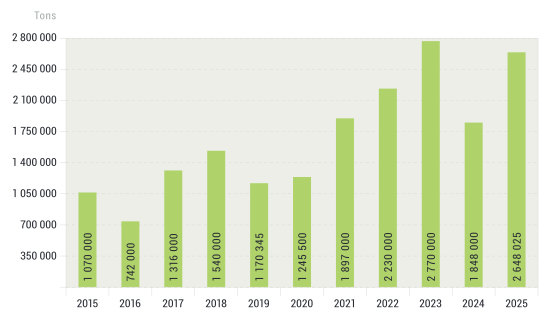
| Area planted Oppervlakte beplant |
Eighth forecast Agtste skatting |
Area planted Oppervlakte beplant |
Final crop Finale oes |
||||||||
|---|---|---|---|---|---|---|---|---|---|---|---|
| 2025 | 2025 | 2024 | 2024 | ||||||||
| White Wit |
Yellow Geel |
Total Totaal |
White Wit |
Yellow Geel |
Total Totaal |
White Wit |
Yellow Geel |
Total Totaal |
White Wit |
Yellow Geel |
Total Totaal |
| Ha | Tons | Ha | Tons | ||||||||
| Western Cape / Wes-Kaap | |||||||||||
| 200 | 3 500 | 3 700 | 1 900 | 32 900 | 34 800 | 250 | 3 500 | 3 750 | 2 300 | 32 200 | 34 500 |
| Northern Cape / Noord-Kaap | |||||||||||
| 1 500 | 42 000 | 43 500 | 18 750 | 672 000 | 690 700 | 1 500 | 42 000 | 43 500 | 18 900 | 648 900 | 667 800 |
| Free State / Vrystaat | |||||||||||
| 850 000 | 345 000 | 1 195 000 | 4 250 000 | 2 397 750 | 6 647 750 | 835 000 | 415 000 | 1 250 000 | 3 385 000 | 1 992 000 | 5 377 000 |
| Eastern Cape / Oos-Kaap | |||||||||||
| 6 000 | 28 000 | 34 000 | 42 600 | 219 899 | 262 400 | 6 000 | 27 000 | 33 000 | 40 800 | 191 700 | 232 500 |
| KwaZulu-Natal | |||||||||||
| 50 000 | 66 000 | 116 000 | 315 000 | 594 000 | 909 000 | 47 000 | 67 000 | 114 000 | 286 700 | 576 200 | 862 900 |
| Mpumalanga | |||||||||||
| 162 000 | 362 000 | 524 000 | 1 085 400 | 2 877 900 | 3 963 300 | 160 000 | 360 000 | 520 000 | 984 000 | 2 490 000 | 3 474 000 |
| Limpopo | |||||||||||
| 10 000 | 18 500 | 28 500 | 71 000 | 157 250 | 228 250 | 11 000 | 15 000 | 26 000 | 74 800 | 120 000 | 194 800 |
| Gauteng | |||||||||||
| 55 000 | 57 000 | 112 000 | 357 500 | 441 750 | 799 250 | 54 000 | 62 000 | 116 000 | 292 500 | 415 500 | 708 000 |
| North West / Noordwes | |||||||||||
| 465 000 | 75 000 | 540 000 | 2 185 500 | 457 500 | 2 643 000 | 440 000 | 90 000 | 530 000 | 970 000 | 328 500 | 1 298 500 |
| Total / Totaal | |||||||||||
| 1 599 700 | 997 000 | 2 596 700 | 8 327 650 | 7 850 850 | 16 178 500 | 1 554 750 | 1 081 500 | 2 636 250 | 6 055 000 | 6 795 000 | 12 850 000 |
| Province / Provinsie | Area planted Oppervlakte beplant |
Eighth forecast Agtste skatting |
Area planted Oppervlakte beplant |
Final crop Finale oes |
|---|---|---|---|---|
| Ha | Tons | Ha | Tons | |
| 2025 | 2025 | 2024 | 2024 | |
| Western Cape / Wes-Kaap | 0 | 0 | 0 | 0 |
| Northern Cape / Noord-Kaap | 1 000 | 2 300 | 2 000 | 4 600 |
| Free State / Vrystaat | 264 500 | 383 525 | 255 000 | 354 000 |
| Eastern Cape / Oos-Kaap | 700 | 1 400 | 700 | 1 400 |
| KwaZulu-Natal | 1 000 | 2 000 | 300 | 600 |
| Mpumalanga | 2 500 | 3 625 | 3 500 | 4 900 |
| Limpopo | 90 000 | 90 000 | 90 000 | 63 000 |
| Gauteng | 1 000 | 1 200 | 2 500 | 3 000 |
| North West / Noordwes | 195 000 | 224 250 | 175 000 | 200 500 |
| Total / Totaal | 555 700 | 708 300 | 529 000 | 632 000 |
| Province / Provinsie | Area planted Oppervlakte beplant |
Eighth forecast Agtste skatting |
Area planted Oppervlakte beplant |
Final crop Finale oes |
|---|---|---|---|---|
| Ha | Tons | Ha | Tons | |
| 2025 | 2025 | 2024 | 2024 | |
| Western Cape / Wes-Kaap | 0 | 0 | 0 | 0 |
| Northern Cape / Noord-Kaap | 2 000 | 7 200 | 1 200 | 4 380 |
| Free State / Vrystaat | 565 000 | 1 271 250 | 545 000 | 688 960 |
| Eastern Cape / Oos-Kaap | 5 500 | 16 500 | 5 300 | 14 310 |
| KwaZulu-Natal | 47 000 | 188 000 | 47 000 | 173 900 |
| Mpumalanga | 315 000 | 756 000 | 320 000 | 624 000 |
| Limpopo | 16 500 | 51 975 | 21 000 | 72 450 |
| Gauteng | 52 000 | 114 400 | 56 000 | 84 000 |
| North West / Noordwes | 148 000 | 347 800 | 155 000 | 186 000 |
| Total / Totaal | 1 151 000 | 2 753 125 | 1 150 500 | 1 848 000 |
| Province / Provinsie | Area planted Oppervlakte beplant |
Eighth forecast Agtste skatting |
Area planted Oppervlakte beplant |
Final crop Finale oes |
|---|---|---|---|---|
| Ha | Tons | Ha | Tons | |
| 2025 | 2025 | 2024 | 2024 | |
| Western Cape / Wes-Kaap | 0 | 0 | 0 | 0 |
| Northern Cape / Noord-Kaap | 3 100 | 8 525 | 4 200 | 8 610 |
| Free State / Vrystaat | 21 700 | 28 210 | 17 000 | 26 305 |
| Eastern Cape / Oos-Kaap | 0 | 0 | 0 | 0 |
| KwaZulu-Natal | 175 | 184 | 300 | 495 |
| Mpumalanga | 0 | 0 | 0 | 0 |
| Limpopo | 1 650 | 2 970 | 1 700 | 4 590 |
| Gauteng | 0 | 0 | 0 | 0 |
| North West / Noordwes | 21 500 | 21 500 | 18 000 | 12 000 |
| Total / Totaal | 48 125 | 61 389 | 41 200 | 52 000 |
| Province / Provinsie | Area planted Oppervlakte beplant |
Eighth forecast Agtste skatting |
Area planted Oppervlakte beplant |
Final crop Finale oes |
|---|---|---|---|---|
| Ha | Tons | Ha | Tons | |
| 2025 | 2025 | 2024 | 2024 | |
| Western Cape / Wes-Kaap | 100 | 200 | 100 | 220 |
| Northern Cape / Noord-Kaap | 950 | 2 280 | 500 | 900 |
| Free State / Vrystaat | 17 500 | 28 876 | 13 500 | 10 800 |
| Eastern Cape / Oos-Kaap | 200 | 400 | 200 | 440 |
| KwaZulu-Natal | 3 000 | 5 100 | 2 100 | 2 730 |
| Mpumalanga | 2 320 | 4 176 | 2 600 | 4 680 |
| Limpopo | 11 100 | 30 525 | 12 200 | 23 790 |
| Gauteng | 950 | 1 900 | 850 | 935 |
| North West / Noordwes | 9 500 | 17 100 | 7 500 | 6 000 |
| Total / Totaal | 45 620 | 90 556 | 39 550 | 50 495 |
| Province / Provinsie | Area planted Oppervlakte beplant |
Eighth forecast Agtste skatting |
Area planted Oppervlakte beplant |
Final crop Finale oes |
|---|---|---|---|---|
| Ha | Tons | Ha | Tons | |
| 2025 | 2025 | 2024 | 2024 | |
| Western Cape / Wes-Kaap | 0 | 0 | 0 | 0 |
| Northern Cape / Noord-Kaap | 0 | 0 | 0 | 0 |
| Free State / Vrystaat | 12 800 | 45 440 | 11 500 | 19 740 |
| Eastern Cape / Oos-Kaap | 200 | 600 | 100 | 300 |
| KwaZulu-Natal | 100 | 380 | 100 | 350 |
| Mpumalanga | 9 200 | 44 160 | 8 300 | 36 520 |
| Limpopo | 13 000 | 35 100 | 18 000 | 35 100 |
| Gauteng | 850 | 3 485 | 100 | 390 |
| North West / Noordwes | 5 000 | 15 500 | 4 000 | 5 600 |
| Total / Totaal | 41 150 | 144 665 | 42 100 | 98 000 |
Summer crops / Somergewasse
Area estimate and eighth production forecast (2025) Oppervlakte- en agtste produksieskatting
Summer field crops – 2025
Commercial maize
The size of the expected commercial maize crop has been set at 16,178 million tons, which is 2,38% or 376 250 tons more than the previous forecast of 15,802 million tons. The expected yield for maize is 6,23 t/ha.
The estimated maize crop is 25,90% or 3,328 million tons larger than the 2024 crop. The three main maize producing areas, namely the Free State, Mpumalanga and North West provinces are expected to produce 82% of the 2025 crop.
The production forecast of white maize increased by 3,05% or 246 300 tons from 8,081 million tons to 8,328 million tons. The area estimate for white maize is 1,600 million ha and the expected yield is 5,21 t/ha.
In the case of yellow maize, the production forecast is 7,851 million tons, which is 1,68% or 129 950 tons more than the 7,721 million tons of the previous forecast. The area estimate for yellow maize is 997 000 ha and the yield is 7,87 t/ha.
The main reason for the increase in the production forecast for white and yellow maize is due to higher producer deliveries as reported by SAGIS.
Other summer crops
Sunflower seed: The production forecast for sunflower seed remained unchanged at 708 300 tons. The area estimate for sunflower seed is 555 700 ha, while the expected yield is 1,27 t/ha.
Other crops
The production forecast for soybeans also remained unchanged at 2,753 million tons. The estimated area planted to soybeans is 1,151 million ha, with an expected yield of 2,39 t/ha.
The expected groundnut crop remained unchanged at 61 389 tons. For groundnuts, the area estimate is 48 125 ha, with an expected yield of 1,28 t/ha.
The production forecast for sorghum is 144 665 tons, which is 4,85% or 6 695 tons more than the previous forecast of 137 970 tons. The area estimate for sorghum is 41 150 ha and the expected yield is 3,52 t/ha.
In the case of dry beans, the production forecast was increased by 4,80% or 4 150 tons from 86 407 tons to 90 556 tons. The area estimate of dry beans is 45 620 ha, with an expected yield of 1,99 t/ha.
Please note that the ninth production forecast for summer field crops for 2025, will be released on 28 October 2025.
Information is available online at the Department of Agriculture, Land Reform and Rural Development or SAGIS, as from 14:30 on the date of the relevant meeting of the Crop Estimates Committee.
Somergewasse – 2025
Kommersiële mielies
Die grootte van die verwagte kommersiële mielie-oes is op 16,178 miljoen ton gestel, wat 2,38% of 376 250 ton meer is as die vorige skatting van 15,802 miljoen ton. Die verwagte opbrengs van mielies is 6,23 t/ha.
Die geskatte mielie-oes is 25,90% of 3,328 miljoen ton meer as die 2024-oes. Die drie belangrikste mielieproduserende gebiede, nl. die Vrystaat, Mpumalanga en Noordwes provinsies, gaan na verwagting 82% van die 2025-oes produseer.
Die produksieskatting van witmielies is verhoog met 3,05% of 246 300 ton, vanaf 8,081 miljoen ton tot 8,328 miljoen ton. Die oppervlakteskatting vir witmielies is 1,600 miljoen ha en die verwagte opbrengs is 5,21 t/ha.
In die geval van geelmielies is die produksieskatting 7,851 miljoen ton, wat 1,68% of 129 950 ton meer is as die 7,721 miljoen ton van die vorige skatting. Die oppervlakteskatting vir geelmielies is 997 000 ha en die opbrengs is 7,87 t/ha.
Die hoofrede vir die toename in die produksieskatting vir wit- en geelmielies is as gevolg van hoër produsentelewerings soos gerapporteer deur SAGIS.
Ander somergewasse
Sonneblomsaad: Die produksieskatting vir sonneblomsaad is onveranderd gelaat op 708 300 ton. Die oppervlakteskatting vir sonneblomsaad is 555 700 ha, terwyl die verwagte opbrengs 1,27 t/ha is.
Ander gewasse
Die produksieskatting van sojabone is ook onveranderd gelaat op 2,753 miljoen ton. Die geskatte oppervlakte beplant van sojabone is 1,151 miljoen ha, met 'n verwagte opbrengs van 2,39 t/ha.
Die verwagte grondbone-oes is onveranderd gelaat op 61 389 ton. Vir grondbone is die oppervlakteskatting 48 125 ha, terwyl die verwagte opbrengs 1,28 t/ha is.
Die produksieskatting van sorghum is 144 665 ton, wat 4,85% of 6 695 ton meer is as die vorige skatting van 137 970 ton. Die oppervlakteskatting vir sorghum is 41 150 ha, en die verwagte opbrengs is 3,52 t/ha.
In die geval van droëbone is die produksieskatting verhoog met 4,80% of 4 150 ton, van 86 407 ton na 90 556 ton. Die oppervlakte beplant met droëbone is 45 620 ha, met 'n verwagte opbrengs van 1,99 t/ha.
Neem asseblief kennis dat die negende produksieskatting vir somergewasse vir 2025, op 28 Oktober 2025 vrygestel sal word.
Inligting is beskikbaar aanlyn by die Department of Agriculture, Land Reform and Rural Development of by SAGIS, vanaf 14:30 op die dag van die toepaslike vergadering van die Oesskattingskomitee.
| Crop / Gewas | Area planted Oppervlakte beplant |
Production Produksie |
Area planted Oppervlakte beplant |
Final crop Finale oes |
Change Verandering |
|---|---|---|---|---|---|
| 2025 | 2025 | 2024 | 2024 | ||
| Ha | Tons | Ha | Tons | % | |
| (A) | (B) | (C) | (D) | (B) ÷ (D) | |
| Non-commercial agriculture / Nie-kommersiële landbou | |||||
| White maize / Witmielies | 275 150 | 439 700 | 267 570 | 407 500 | +7.90 |
| Yellow maize / Geelmielies | 82 850 | 181 800 | 79 430 | 167 500 | +8.54 |
| Maize / Mielies | 358 000 | 621 500 | 347 000 | 575 000 | +8.09 |
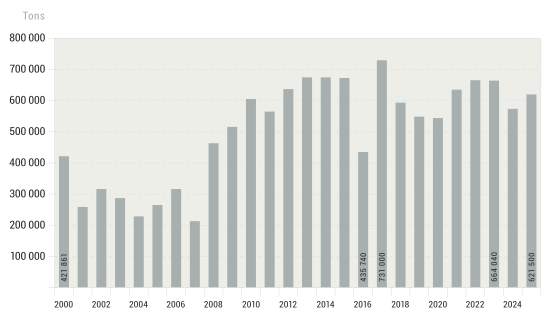
The area planted to maize in the non-commercial agricultural sector is estimated at 358 000 ha, which represents an increase of 3,17%, compared to the 347 000 ha of the previous season. The expected maize crop for this sector is 621 500 tons, which is 8,09% more than the 575 000 tons of last season. It is important to note that about 46,75% of the maize produced in the non-commercial sector, is planted in the Eastern Cape, followed by KwaZulu-Natal with 20,88% and then Limpopo with 20,65%.
Die voorlopige oppervlakte beplant met mielies in die nie-kommersiële landbou-sektor word geskat op 358 000 ha, wat 'n toename van 3,17% verteenwoordig in vergelyking met die 347 000 ha van die vorige seisoen. Die verwagte mielie-oes van dié sektor is 621 500 ton, wat 8,09% meer is as die 575 000 ton van die vorige seisoen. Dit is belangrik om daarop te let dat ongeveer 46,75% van die mielies wat geproduseer word in die nie-kommersiële sektor, in die Oos-Kaap geplant word, gevolg deur KwaZulu-Natal met 20,88% en dan Limpopo met 20,65%.
Area 2000-2025 Oppervlakte
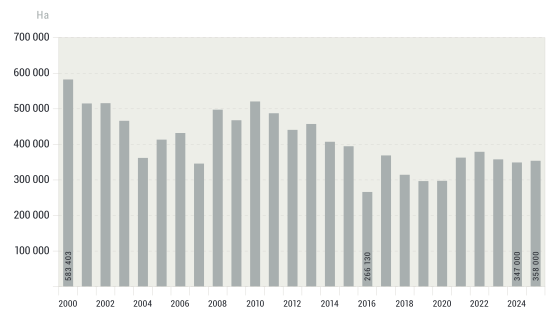
Production 2000-2025 Produksie
| Crop / Gewas | Area planted Oppervlakte beplant |
Second forecast Tweede skatting |
First forecast Eerste skatting |
Area planted Oppervlakte beplant |
Final crop Finale oes |
Change / Verandering |
|---|---|---|---|---|---|---|
| 2025 | 2025 | 2025 | 2024 | 2024 | ||
| Ha | Tons | Tons | Ha | Tons | % | |
| (A) | (B) | (C) | (D) | (E) | (B) ÷ (C) | |
| Commercial / Kommersieël | ||||||
| Wheat / Koring | 517 300 | 2 034 380 | 2 043 530 | 505 300 | 1 930 000 | -0.4 |
| Barley / Gars | 96 950 | 346 430 | 352 675 | 100 700 | 372 250 | -1.8 |
| Canola | 174 515 | 311 640 | 320 043 | 165 750 | 290 400 | -2.6 |
| Oats / Hawer | 35 520 | 57 213 | 57 213 | 31 000 | 43 400 | – |
| Sweet lupins / Soetlupine | 21 000 | 21 000 | 23 100 | 16 000 | 19 200 | -9.1 |
| Total winter / Totaal winter | 845 285 | 2 770 663 | 2 796 561 | 818 750 | 2 655 250 | -0.9 |
1) Commercial only. Excluding barley or oats used as pasture, silage, hay and/or on the farm as fodder for livestock. / Slegs kommersieël. Uitgesluit gars of hawer wat gebruik word as weiding, kuilvoer, hooi en/of op die plaas as voer vir vee.
| Province / Provinsie | Area planted Oppervlakte beplant |
Second forecast Tweede skatting |
Area planted Oppervlakte beplant |
Final crop Finale oes |
|---|---|---|---|---|
| Ha | Tons | Ha | Tons | |
| 2025 | 2025 | 2024 | 2024 | |
| Western Cape / Wes-Kaap | 363 000 | 1 052 700 | 368 000 | 1 067 200 |
| Northern Cape / Noord-Kaap | 40 000 | 308 000 | 38 000 | 298 300 |
| Free State / Vrystaat | 57 000 | 302 100 | 49 000 | 225 260 |
| Eastern Cape / Oos-Kaap | 5 500 | 37 400 | 5 000 | 34 500 |
| KwaZulu-Natal | 8 500 | 52 700 | 8 300 | 52 290 |
| Mpumalanga | 3 500 | 22 750 | 3 500 | 24 500 |
| Limpopo | 28 000 | 179 200 | 20 500 | 145 550 |
| Gauteng | 800 | 5 280 | 1 000 | 6 800 |
| North West / Noordwes | 11 000 | 74 250 | 12 000 | 75 600 |
| Total / Totaal | 517 300 | 2 034 380 | 505 300 | 1 930 000 |
Production 2015-2025 Produksie
Production 2015-2025 Produksie
Production 2015-2025 Produksie
Winter cereal crops / Wintergewasse
Revised area estimate and second production forecast for 2025 / Hersiene oppervlakteskatting en tweede produksieskatting vir 2025
Winter cereal crops – 2025
Wheat
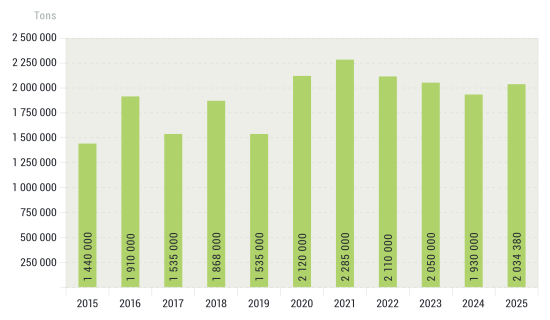
The expected production of wheat is 2,034 million tons, which is 0,45% or 9 150 tons less than the previous month's forecast of 2,044 million tons, whilst the expected yield is 3,93 t/ha.
The expected production in the Western Cape is 1,053 million tons (52%), which is 54 450 tons less than the 1,107 million tons of the previous month's forecast. In the Northern Cape, 308 000 tons (15%) are expected to be produced – 3 850 tons more than the 304 150 tons forecasted in the previous month. In the Free State, the expected production is 302 100 tons (15%), which is 21 600 tons more than the previous month's expected crop of 280 500 tons.
The area estimate for wheat was revised to 517 300 ha, which is 5 600 ha more than the 511 700 ha of the previous month's area estimate. An estimated 363 000 ha or 70% is planted in the Western Cape, 57 000 ha or 11% in the Free State and 40 000 ha or 8% in the Northern Cape.
Other crops
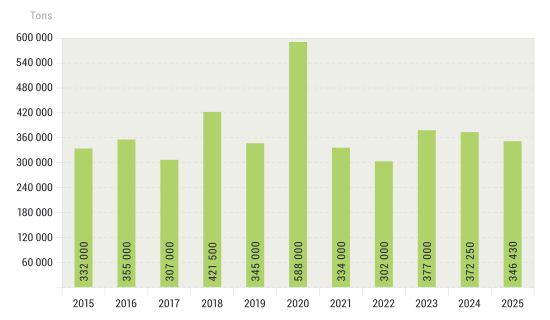
The production forecast for barley is 346 430 tons, which is 1,77% or 6 245 tons less than the previous month's crop forecast of 352 675 tons. The area planted is estimated at 96 950 ha, while the expected yield is 3,57 t/ha.
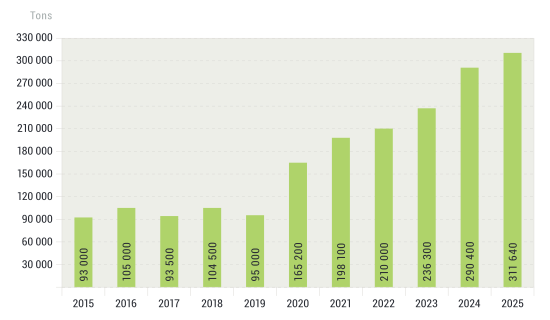
The expected canola crop is 311 640 tons, which is 2,63% or 8 403 tons less than the previous month's crop forecast of 320 043 tons. This is the largest canola crop on record. The area estimate for canola is 174 515 ha, with an expected yield of 1,79 t/ha.
The expected crop for oats for the 2025 season is 57 213 tons and the area planted is 35 520 ha. The expected yield is 1,61 t/ha.
In the case of sweet lupins, the production forecast is 21 000 tons. The area estimate of sweet lupines is 21 000 ha, with an expected yield of 1,00 t/ha.
Please note that the third production forecast for winter cereals for 2025 will be released on 28 October 2025.
Information is available online at the Department of Agriculture, Land Reform and Rural Development or SAGIS, as from 14:30 on the date of the relevant meeting of the Crop Estimates Committee.
Wintergewasse – 2025
Koring
Die verwagte produksie vir koring is 2,034 miljoen ton, wat 0,45% of 9 150 ton minder is as die vorige maand se skatting van 2,044 miljoen ton, terwyl die verwagte opbrengs 3,93 t/ha is.
Die verwagte produksie in die Wes-Kaap is 1,053 miljoen ton (52%), wat 54 450 ton minder is as die 1,107 miljoen ton van die vorige maand se skatting. In die Noord-Kaap word verwag dat 308 000 ton (15%) geproduseer sal word – 3 850 ton meer as die 304 150 ton wat in die vorige maand geskat is. In die Vrystaat is die verwagte produksie 302 100 ton (15%), wat 21 600 ton meer is as die vorige maand se verwagte oes van 280 500 ton.
Die oppervlakteskatting vir koring is hersien na 517 300 ha, wat 5 600 ha meer is as die 511 700 ha van die vorige maand se oppervlakteskatting. Die beraamde oppervlakte geplant in die Wes-Kaap is 363 000 ha of 70%, die Vrystaat is 57 000 ha of 11% en 40 000 ha of 8% is in die Noord-Kaap.
Ander gewasse
Die produksieskatting vir gars is 346 430 ton, wat 1,77% of 6 245 ton minder is as die vorige maand se oesskatting van 352 675 ton. Die oppervlakte beplant word beraam op 96 950 ha, terwyl die verwagte opbrengs 3,57 t/ha beloop.
Die verwagte canola-oes is 311 640 ton, wat 2,63% of 8 403 ton minder is as die vorige maand se oesskatting van 320 043 ton. Dit is die grootste canola-oes op rekord. Die oppervlakteskatting vir canola is 174 515 ha, met ʼn verwagte opbrengs van 1,79 t/ha.
Die verwagte oes vir hawer vir die 2025-seisoen is 57 213 ton en die oppervlakteskatting is 35 520 ha. Die verwagte opbrengs is 1,61 t/ha.
In die geval van soetlupine is die produksieskatting 21 000 ton. Die oppervlakte beplant met soetlupine is 21 000 ha, en die verwagte opbrengs is 1,00 t/ha.
Neem asseblief kennis dat die derde produksieskatting vir wintergewasse vir 2025 op 28 Oktober 2025 vrygestel sal word.
Inligting is beskikbaar aanlyn by die Department of Agriculture, Land Reform and Rural Development of by SAGIS, vanaf 14:30 op die dag van die toepaslike vergadering van die Oesskattingskomitee.
CONFIDENTIALITY ISSUES that CEC members are committed to adhere to on the day of the meeting
- Personal items such as laptops, handbags, cell phones, etc. are not allowed in the venue during the meeting (if in-person meeting).
- No member is allowed to leave the meeting before 12:00 in order to prevent disclosure of the information.
- The embargo time for the release of crop estimates information is 14:30.
- No member is allowed to discuss crop estimates information with anyone other than a member of the Committee before the embargo time.
- Only the Chairperson, or a member appointed by the Chairperson, may release the figures to the media.
- Members must regard the detail of any information that was collected for and/or discussed during the meeting, as confidential.
- Individual information received for crop estimate purposes is treated strictly confidential, and is not divulged for any other purposes.