


Intentions to plant summer crops (2027), ninth 2026 summer crops and third 2026 winter cereal forecast estimates
Summer crops
- Summer crops – intentions
- Graph: Total maize
- Graph: Sunflower seed
- Graph: Soybeans
- White and yellow maize – intentions
- Sunflower seed – intentions
- Soybeans – intentions
- Notes – intentions
- Summer crops
- Graph: Total maize
- Graph: White maize
- Graph: Yellow maize
- White and yellow maize
- Sunflower seed
- Soybeans
- Groundnuts
Winter cereals

Estimates courtecy of the Crop Estimates Committee
| Crop | Intentions | Area planted | Ninth estimate | Change |
|---|---|---|---|---|
| 2027 as mid Oct 2026 |
2026 | 2026 as on 27 Oct 2026 |
||
| Ha | Ha | Tons | % | |
| (A) | (B) | (C) | (A) ÷ (B) | |
| Commercial | ||||
| White maize | 1 370 200 | 1 674 700 | 9 777 340 | -18.18 |
| Yellow maize | 1 017 000 | 1 049 500 | 7 914 050 | -3.10 |
| Total maize | 2 387 200 | 2 724 200 | 17 691 390 | -12.37 |
| Sunflower seed | 824 600 | 570 100 | 874 805 | 44.64 |
| Soybeans | 1 205 300 | 1 212 700 | 3 010 175 | -0.61 |
| Groundnuts | 43 280 | 44 650 | 65 620 | -3.07 |
| Sorghum | 39 500 | 40 000 | 123 325 | -1.25 |
| Dry beans | 35 770 | 38 520 | 80 695 | -7.14 |
| Total | 4 535 650 | 4 630 170 | 21 846 010 | -2.04 |
Note: Estimate is for calendar year, for example production season 2026/2027 = 2027
Area planted 2015-2027
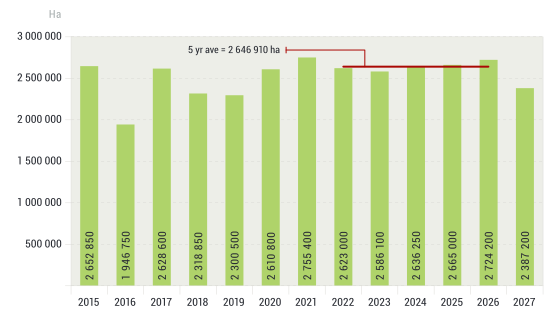
Area planted 2015-2027

Area planted 2015-2027
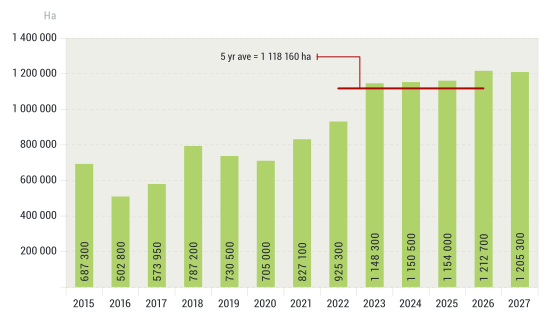
| Intentions (area planted) | Area planted | Ninth estimate¹ | ||||||
|---|---|---|---|---|---|---|---|---|
| 2027 | 2026 | 2026 | ||||||
| White | Yellow | Total | White | Yellow | Total | White | Yellow | Total |
| Ha | Ha | Tons | ||||||
| Western Cape | ||||||||
| 200 | 4 000 | 4 200 | 200 | 4 000 | 4 200 | 1 840 | 38 000 | 39 840 |
| Northern Cape | ||||||||
| 2 500 | 40 000 | 42 500 | 3 000 | 42 500 | 45 500 | 40 500 | 680 000 | 720 500 |
| Free State | ||||||||
| 715 000 | 365 000 | 1 080 000 | 845 000 | 370 000 | 1 215 000 | 4 943 250 | 2 460 500 | 7 403 750 |
| Eastern Cape | ||||||||
| 6 000 | 31 000 | 37 000 | 6 000 | 30 000 | 36 000 | 43 800 | 276 000 | 319 800 |
| KwaZulu-Natal | ||||||||
| 50 000 | 71 000 | 121 000 | 47 000 | 72 000 | 119 000 | 310 200 | 640 800 | 951 000 |
| Mpumalanga | ||||||||
| 170 000 | 350 000 | 520 000 | 172 000 | 366 000 | 538 000 | 1 032 000 | 2 653 500 | 3 685 500 |
| Limpopo | ||||||||
| 10 000 | 21 000 | 31 000 | 16 000 | 20 000 | 36 000 | 108 800 | 170 000 | 278 800 |
| Gauteng | ||||||||
| 55 000 | 67 000 | 122 000 | 60 500 | 65 000 | 125 500 | 356 950 | 471 250 | 828 200 |
| North West | ||||||||
| 361 500 | 68 000 | 429 500 | 525 000 | 80 000 | 605 000 | 2 940 000 | 524 000 | 3 464 000 |
| Total | ||||||||
| 1 370 200 | 1 017 000 | 2 387 200 | 1 674 700 | 1 049 500 | 2 724 200 | 9 777 340 | 7 914 050 | 17 691 390 |
¹ 27 October 2026.
| Province | Area planted | Area planted | Ninth estimate¹ |
|---|---|---|---|
| Ha | Ha | Tons | |
| 2027 | 2026 | 2026 | |
| Western Cape | 0 | 0 | 0 |
| Northern Cape | 500 | 500 | 1 150 |
| Free State | 455 000 | 309 000 | 494 400 |
| Eastern Cape | 500 | 500 | 1 000 |
| KwaZulu-Natal | 1 500 | 1 500 | 3 000 |
| Mpumalanga | 6 000 | 6 000 | 9 000 |
| Limpopo | 100 000 | 96 500 | 101 325 |
| Gauteng | 1 100 | 1 100 | 1 430 |
| North West | 260 000 | 155 000 | 263 500 |
| Total | 824 600 | 570 100 | 874 805 |
¹ 27 October 2026.
| Province | Area planted | Area planted | Ninth estimate¹ |
|---|---|---|---|
| Ha | Ha | Tons | |
| 2026 | 2026 | 2026 | |
| Western Cape | 200 | 200 | 700 |
| Northern Cape | 2 000 | 2 000 | 7 000 |
| Free State | 585 000 | 607 000 | 1 456 800 |
| Eastern Cape | 6 100 | 7 500 | 25 500 |
| KwaZulu-Natal | 45 000 | 44 000 | 176 000 |
| Mpumalanga | 340 000 | 314 500 | 676 175 |
| Limpopo | 15 000 | 17 500 | 63 000 |
| Gauteng | 57 000 | 55 000 | 126 500 |
| North West | 155 000 | 165 000 | 478 500 |
| Total | 1 205 300 | 1 212 700 | 3 010 175 |
¹ 27 October 2026.
Summer crops
Intentions to plant (2027)
Producers intentions to plant summer crops are mainly based on the results of a non-probability survey conducted by the Directorate: Statistics and Economic Analysis of the Department of Agriculture, and reflects the position as at the middle of October 2026. Various factors can, however, still influence these intentions up until planting time.
According to the results of the survey, commercial producers intend to plant 2,387 million ha of maize for 2027, which is 12,4% or 337 000 ha less than the 2,724 million ha planted the past season (2026).
The figures show that producers intend to plant 1,370 million ha to white maize, which is 304 500 ha (18,2%) less than the past season. In the case of yellow maize, the expected plantings are 1,017 million ha, which is 32 500 ha (3,1%) less than in the past season.
In the case of sunflower seed, the expected area planted is estimated at 824 600 ha, which is 44,6% or 254 500 ha more than the 570 100 ha planted the previous season. This is the second largest plantings on record for sunflower seed since 1999 when 828 000 ha were planted.
The intended plantings of soybeans shows a decrease of 0,6% or 7 400 ha compared to the previous season – from 1,213 million ha to 1,205 million ha.
The expected plantings of groundnuts will decrease by 3,1% or 1 370 ha, from 44 650 ha to 43 280 ha.
The intended plantings of sorghum is expected to decrease by 1,3% or 500 ha to 39 500 ha, compared to the past season.
The expected plantings of dry beans is estimated at 35 770 ha, which is 7,1% or 2 750 ha less than in the previous season.
Please note that the preliminary area planted estimate for summer grains for 2027 will be released on 27 January 2027.
| Crop | Area planted | Ninth forecast | Eighth forecast | Area planted | Final crop | Change |
|---|---|---|---|---|---|---|
| 2026 | 2026 | 2026 | 2025 | 2025 | ||
| Ha | Tons | Tons | Ha | Tons | % | |
| (A) | (B) | (C) | (D) | (E) | (B) ÷ (C) | |
| Commercial | ||||||
| White maize | 1 674 700 | 9 777 340 | 9 608 790 | 1 635 000 | 8 500 000 | 1.75 |
| Yellow maize | 1 049 500 | 7 914 050 | 7 914 050 | 1 030 000 | 8 225 000 | 0.00 |
| Total Maize | 2 724 200 | 17 691 390 | 17 522 840 | 2 665 000 | 16 725 000 | 0.96 |
| Sunflower seed | 570 100 | 874 805 | 874 805 | 555 700 | 708 635 | 0.00 |
| Soybeans | 1 212 700 | 3 010 175 | 3 010 175 | 1 154 000 | 2 800 000 | 0.00 |
| Groundnuts | 44 650 | 65 620 | 65 620 | 48 750 | 63 350 | 0.00 |
| Sorghum | 40 000 | 123 325 | 123 325 | 41 350 | 154 000 | -0.00 |
| Dry beans | 38 520 | 80 695 | 80 695 | 45 620 | 90 556 | 0.00 |
| Total | 4 630 170 | 21 846 010 | 21 677 460 | 4 510 420 | 20 541 541 | 0.78 |
| Non-commercial Maize | ||||||
| Total maize | 397 170 | 695 025 | 695 025 | 358 000 | 621 500 | 0.00 |
| Maize: Commercial | ||||||
| Total maize RSA | 3 121 370 | 18 386 415 | 18 217 865 | 3 023 000 | 17 346 500 | 0.93 |
Notes:
Estimate is for calendar year, for example production season 2025/2026 = 2026
| Area planted | Ninth forecast | Area planted | Final crop | ||||||||
|---|---|---|---|---|---|---|---|---|---|---|---|
| 2026 | 2026 | 2025 | 2025 | ||||||||
| White | Yellow | Total | White | Yellow | Total | White | Yellow | Total | White | Yellow | Total |
| Ha | Tons | Ha | Tons | ||||||||
| Western Cape | |||||||||||
| 200 | 4 000 | 4 200 | 1 840 | 38 000 | 39 840 | 200 | 3 500 | 3 700 | 1 900 | 32 525 | 34 425 |
| Northern Cape | |||||||||||
| 3 000 | 42 500 | 45 500 | 40 500 | 680 000 | 720 500 | 3 000 | 43 500 | 46 500 | 37 950 | 700 350 | 738 300 |
| Free State | |||||||||||
| 845 000 | 370 000 | 1 215 000 | 4 943 250 | 2 460 500 | 7 403 750 | 865 000 | 360 000 | 1 225 000 | 4 238 500 | 2 520 000 | 6 758 500 |
| Eastern Cape | |||||||||||
| 6 000 | 30 000 | 36 000 | 43 800 | 276 000 | 319 800 | 6 000 | 28 000 | 34 000 | 43 200 | 240 800 | 284 000 |
| KwaZulu-Natal | |||||||||||
| 47 000 | 72 000 | 119 000 | 310 200 | 640 800 | 951 000 | 50 000 | 66 000 | 116 000 | 325 000 | 617 100 | 942 100 |
| Mpumalanga | |||||||||||
| 172 000 | 366 000 | 538 000 | 1 032 000 | 2 653 500 | 3 685 500 | 168 000 | 362 500 | 530 500 | 1 142 400 | 2 918 125 | 4 060 525 |
| Limpopo | |||||||||||
| 16 000 | 20 000 | 36 000 | 108 800 | 170 000 | 278 800 | 10 000 | 18 500 | 28 500 | 71 000 | 159 100 | 230 100 |
| Gauteng | |||||||||||
| 60 500 | 65 000 | 125 500 | 356 950 | 471 250 | 828 200 | 57 500 | 70 000 | 127 500 | 382 375 | 549 500 | 931 875 |
| North West | |||||||||||
| 525 000 | 80 000 | 605 000 | 2 940 000 | 524 000 | 3 464 000 | 475 300 | 78 000 | 553 300 | 2 257 675 | 487 500 | 2 745 175 |
| Total / Totaal | |||||||||||
| 1 674 700 | 1 049 500 | 2 724 200 | 9 777 340 | 7 914 050 | 17 691 390 | 1 635 000 | 1 030 000 | 2 665 000 | 8 500 000 | 8 225 000 | 16 725 000 |
| Province | Area planted | Ninth forecast | Area planted | Final crop |
|---|---|---|---|---|
| Ha | Tons | Ha | Tons | |
| 2026 | 2026 | 2025 | 2025 | |
| Western Cape | 0 | 0 | 0 | 0 |
| Northern Cape | 500 | 1 150 | 1 000 | 2 400 |
| Free State | 309 000 | 494 400 | 264 500 | 383 525 |
| Eastern Cape | 500 | 1 000 | 700 | 1 435 |
| KwaZulu-Natal | 1 500 | 3 000 | 1 000 | 2 000 |
| Mpumalanga | 6 000 | 9 000 | 2 500 | 3 625 |
| Limpopo | 96 500 | 101 325 | 90 000 | 90 000 |
| Gauteng | 1 100 | 1 430 | 1 000 | 1 400 |
| North West | 155 000 | 263 500 | 195 000 | 224 250 |
| Total | 570 100 | 874 805 | 555 700 | 708 635 |
| Province | Area planted | Ninth forecast | Area planted | Final crop |
|---|---|---|---|---|
| Ha | Tons | Ha | Tons | |
| 2026 | 2026 | 2025 | 2025 | |
| Western Cape | 200 | 700 | 0 | 0 |
| Northern Cape | 2 000 | 7 000 | 2 000 | 7 600 |
| Free State | 607 000 | 1 456 800 | 568 000 | 1 306 400 |
| Eastern Cape | 7 500 | 25 500 | 5 500 | 16 775 |
| KwaZulu-Natal | 44 000 | 176 000 | 47 000 | 183 300 |
| Mpumalanga | 314 500 | 676 175 | 315 000 | 771 750 |
| Limpopo | 17 500 | 63 000 | 16 500 | 51 975 |
| Gauteng | 55 000 | 126 500 | 52 000 | 114 400 |
| North West | 165 000 | 478 500 | 148 000 | 347 800 |
| Total | 1 212 700 | 3 010 175 | 1 154 000 | 2 800 000 |
| Province | Area planted | Ninth forecast | Area planted | Final crop |
|---|---|---|---|---|
| Ha | Tons | Ha | Tons | |
| 2026 | 2026 | 2025 | 2025 | |
| Western Cape | 0 | 0 | 0 | 0 |
| Northern Cape | 2 550 | 6 884 | 3 100 | 8 525 |
| Free State | 16 750 | 24 288 | 21 800 | 29 648 |
| Eastern Cape | 0 | 0 | 0 | 0 |
| KwaZulu-Natal | 200 | 360 | 175 | 182 |
| Mpumalanga | 0 | 0 | 0 | 0 |
| Limpopo | 2 650 | 5 963 | 1 650 | 2 970 |
| Gauteng | 0 | 0 | 0 | 0 |
| North West | 22 500 | 28 125 | 22 025 | 22 025 |
| Total | 44 650 | 65 620 | 48 750 | 63 350 |
| Province | Area planted | Ninth forecast | Area planted | Final crop |
|---|---|---|---|---|
| Ha | Tons | Ha | Tons | |
| 2026 | 2026 | 2025 | 2025 | |
| Western Cape | 100 | 200 | 100 | 200 |
| Northern Cape | 750 | 1 838 | 950 | 2 280 |
| Free State | 9 000 | 14 850 | 17 500 | 28 875 |
| Eastern Cape | 170 | 340 | 200 | 400 |
| KwaZulu-Natal | 1 500 | 3 450 | 3 000 | 5 100 |
| Mpumalanga | 1 950 | 3 218 | 2 320 | 4 176 |
| Limpopo | 18 350 | 44 040 | 11 100 | 30 525 |
| Gauteng | 300 | 600 | 950 | 1 900 |
| North West | 6 400 | 12 160 | 9 500 | 17 100 |
| Total | 38 520 | 80 695 | 45 620 | 90 556 |
| Province | Area planted | Ninth forecast | Area planted | Final crop |
|---|---|---|---|---|
| Ha | Tons | Ha | Tons | |
| 2026 | 2026 | 2025 | 2025 | |
| Western Cape | 0 | 0 | 0 | 0 |
| Northern Cape | 0 | 0 | 0 | 0 |
| Free State | 10 500 | 26 250 | 13 000 | 47 450 |
| Eastern Cape | 100 | 300 | 200 | 620 |
| KwaZulu-Natal | 100 | 350 | 100 | 375 |
| Mpumalanga | 7 400 | 36 260 | 9 200 | 44 620 |
| Limpopo | 16 000 | 44 000 | 13 000 | 40 950 |
| Gauteng | 550 | 2 255 | 850 | 3 485 |
| North West | 5 350 | 13 910 | 5 000 | 16 500 |
| Total | 40 000 | 123 325 | 41 350 | 154 000 |
Summer crops
Area estimate and ninth production forecast (2026)
Summer field crops – 2026
Commercial maize
The size of the expected commercial maize crop has been set at 17,691 million tons, which is 0,96% or 168 550 tons more than the previous forecast of 17,523 million tons. This is the largest maize crop on record. The expected average yield is 6,49 t/ha.
The estimated maize crop is 5,78% or 966 390 tons more than the 2025 crop. The three main maize producing areas, namely the Free State, Mpumalanga and North West provinces are expected to produce 82% of the 2026 crop.
The production forecast of white maize is 9,777 million tons, which is 1,75% or 168 550 tons more than the 9,609 million tons of the previous forecast. The area estimate for white maize is 1,675 million ha with an expected average yield of 5,84 t/ha.
The production forecast for yellow maize remained unchanged at 7,914 million tons. The area estimate is 1,050 million ha, with an expected average yield of 7,54 t/ha.
Other summer crops
Sunflower seed: The production forecast for sunflower seed remained unchanged at 874 805 tons. The area estimate for sunflower seed is 570 100 ha, while the expected yield is 1,53 t/ha.
Other crops
The production forecast for soybeans also remained unchanged at 3,010 million tons. This is the largest soybean crop on record. The estimated area planted to soybeans is 1,213 million ha, with an expected average yield of 2,48 t/ha.
The expected groundnut crop remained unchanged at 65 620 tons. For groundnuts, the area estimate is 44 650 ha, with an expected yield of 1,47 t/ha.
The production forecast for sorghum also remained unchanged at 123 325 tons, The area estimate for sorghum is 40 000 ha and the expected yield is 3,08 t/ha. Please note that the sorghum production estimate remains unchanged, despite being higher than the current producer deliveries monitored by the South African Grain Information Services (SAGIS). It has, however, been confirmed that some producers are retaining a portion of the sorghum produced during the 2025/26 production season on their farms and intend to deliver it only in a future marketing season. Consequently, current deliveries may not fully reflect the total production for the 2025/26 season.
In the case of dry beans, the production forecast remained unchanged at 80 695 tons. The estimated area planted is 38 520 ha, with an expected yield of 2,09 t/ha.
Please note that the final production estimate for summer field crops for 2026 will be released on 26 November 2026.
Information is available online at the Department of Agriculture, Land Reform and Rural Development or SAGIS, as from 14:30 on the date of the relevant meeting of the Crop Estimates Committee.
| Crop / Gewas | Area planted Oppervlakte beplant |
Production Produksie |
Area planted Oppervlakte beplant |
Final crop Finale oes |
Change Verandering |
|---|---|---|---|---|---|
| 2026 | 2026 | 2025 | 2025 | ||
| Ha | Tons | Ha | Tons | % | |
| (A) | (B) | (C) | (D) | (B) ÷ (D) | |
| Non-commercial agriculture | |||||
| White maize | 261 305 | 390 720 | 252 030 | 389 410 | +0.3 |
| Yellow maize | 135 865 | 304 305 | 105 970 | 232 090 | +31.1 |
| Maize | 397 170 | 695 025 | 358 000 | 621 500 | +11.8 |
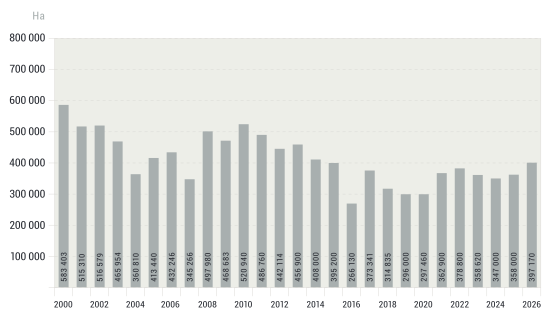
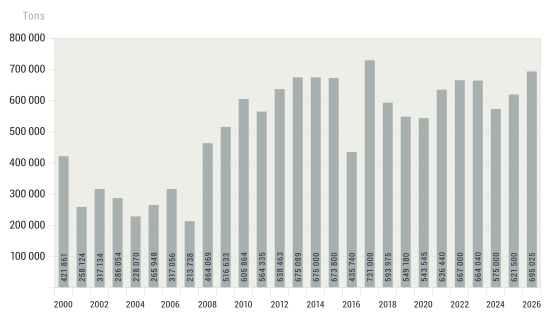
The area planted to maize in the non-commercial agricultural sector is estimated at 397 170 ha, which represents an increase of 10,94%, compared to the 358 000 ha of the previous season. The expected maize crop for this sector is 695 025 tons, which is 11,83% more than the 621 500 tons of last season. It is important to note that about 36,96% of the maize produced in the non-commercial sector, is planted in the Eastern Cape, followed by Limpopo with 31,00% and then KwaZulu-Natal with 21,90%.
Area 2000-2026
Production 2000-2026
| Crop | Area planted | Third forecast | Second forecast | Area planted | Final crop | Change |
|---|---|---|---|---|---|---|
| 2026 | 2026 | 2026 | 2025 | 2025 | ||
| Ha | Tons | Tons | Ha | Tons | % | |
| (A) | (B) | (C) | (D) | (E) | (B) ÷ (C) | |
| Commercial | ||||||
| Wheat | 487 500 | 1 789 220 | 1 805 720 | 517 300 | 1 905 500 | -0.9% |
| Barley | 105 320 | 409 940 | 414 640 | 96 950 | 345 000 | -1.1% |
| Canola | 197 890 | 368 270 | 377 770 | 174 515 | 306 000 | -2.5% |
| Oats | 40 800 | 55 850 | 55 850 | 35 520 | 43 500 | 0.0% |
| Sweet lupins | 20 000 | 17 000 | 18 000 | 21 000 | 17 850 | -5.6% |
| Total winter | 851 510 | 2 640 280 | 2 671 980 | 845 285 | 2 617 850 | -1.2% |
1) Commercial only. Excluding barley or oats used as pasture, silage, hay and/or on the farm as fodder for livestock.
| Province | Area planted | Third forecast | Area planted | Final crop |
|---|---|---|---|---|
| 2026 | 2026 | 2025 | 2025 | |
| Ha | Tons | Ha | Tons | |
| Western Cape | 330 000 | 874 500 | 363 000 | 980 100 |
| Northern Cape | 40 000 | 288 000 | 40 000 | 302 000 |
| Free State | 64 000 | 300 800 | 57 000 | 270 750 |
| Eastern Cape | 5 700 | 39 900 | 5 500 | 37 950 |
| KwaZulu-Natal | 8 400 | 50 400 | 8 500 | 51 000 |
| Mpumalanga | 3 100 | 20 770 | 3 500 | 22 400 |
| Limpopo | 25 000 | 160 000 | 28 000 | 165 200 |
| Gauteng | 800 | 5 200 | 800 | 5 150 |
| North West | 10 500 | 66 150 | 11 000 | 70 950 |
| Total | 487 500 | 1 789 220 | 517 300 | 1 905 500 |
Production 2015-2026
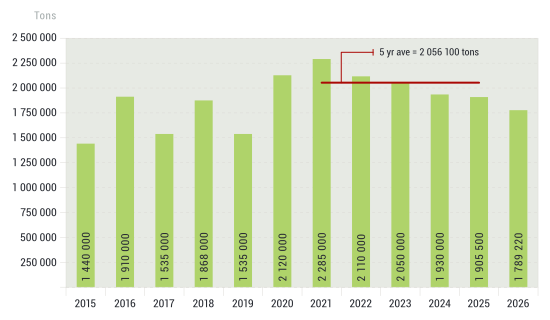
Production 2015-2026
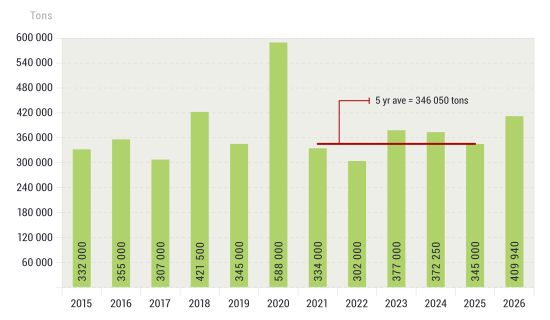
Production 2015-2026

Winter cereal crops
Area estimate and third production forecast for 2026
Winter cereal crops – 2026
Wheat
The expected production of wheat is 1,789 million tons, which is 0,91% or 16 500 tons less than the previous forecast of 1,806 million tons, whilst the expected yield is 3,67 t/ha.
The expected production in the Western Cape is 858 000 tons (48%), which is 16 500 tons less than the previous month's forecast of 874 500 tons. In the Northern Cape, 288 000 tons (16%) is expected to be produced – unchanged from the previous month's forecast. In the Free State, the expected production is 300 800 tons (17%) – the same as the previous month's forecast.
The estimated area planted to wheat is 487 550 ha, the lowest since the 2015/16 production season, when the area was estimated at 482 150 ha. An estimated 330 000 ha or 68% is planted in the Western Cape, 64 000 ha or 13% in the Free State and 40 000 ha or 8% in the Northern Cape.
Other crops
The production forecast for barley was decreased by 1,13% or 4 700 tons, from 414 640 tons to 409 940 tons. The area planted is estimated at 105 320 ha, while the expected yield is 3,89 t/ha.
The expected canola crop is 368 270 tons, which is 2,51% or 9 500 tons less than the previous month's crop forecast of 377 770 tons. This is the largest canola crop on record. The area estimate for canola is 197 890 ha, with an expected yield of 1,86 t/ha.
The crop for oats for the 2026 season remained unchanged at 55 850 tons. The area planted is 40 800 ha. The expected yield is 1,37 t/ha.
In the case of sweet lupins, the production estimate is 17 000 tons, which is 5,56% or 1 000 tons less than the previous month's expected crop of 18 000 tons. The area estimate of sweet lupines is 20 000 ha, with an expected yield of 0,85 t/ha.
Please note that the fourth production forecast for winter cereals for 2026 will be released on 26 November 2026.
Information is available online at the Department of Agriculture, Land Reform and Rural Development or SAGIS, as from 14:30 on the date of the relevant meeting of the Crop Estimates Committee.
CONFIDENTIALITY REQUIREMENTS for CEC members on the day of the meeting
- Personal items such as laptops, handbags, cellular phones and other electronic devices are not permitted in the meeting venue.
- Crop estimate discussions by members of the Committee may only commence from 12:00 on the day of the meeting.
- The embargo time for the public release of crop estimates information is 15:30.
- Before the embargo time, members may not discuss crop estimates information with anyone other than fellow Committee members.
- Only the Chairperson, or a member authorised by the Chairperson, may release crop estimate information to the media.
- Members must treat all information collected for, presented at, or discussed during the meeting as strictly confidential.
- Individual information received for crop estimate purposes must be treated as strictly confidential and may not be disclosed or used for any purpose other than the crop estimation process.